
Clinton wins City College vote
By David Horowitz
Hillary Clinton’s 1.5 percent lead in the national popular vote against Donald Trump is greater than any American president who has lost an election since 1876. However, it pales in comparison to her dominant popularity according to a survey taken of 129 City College students.
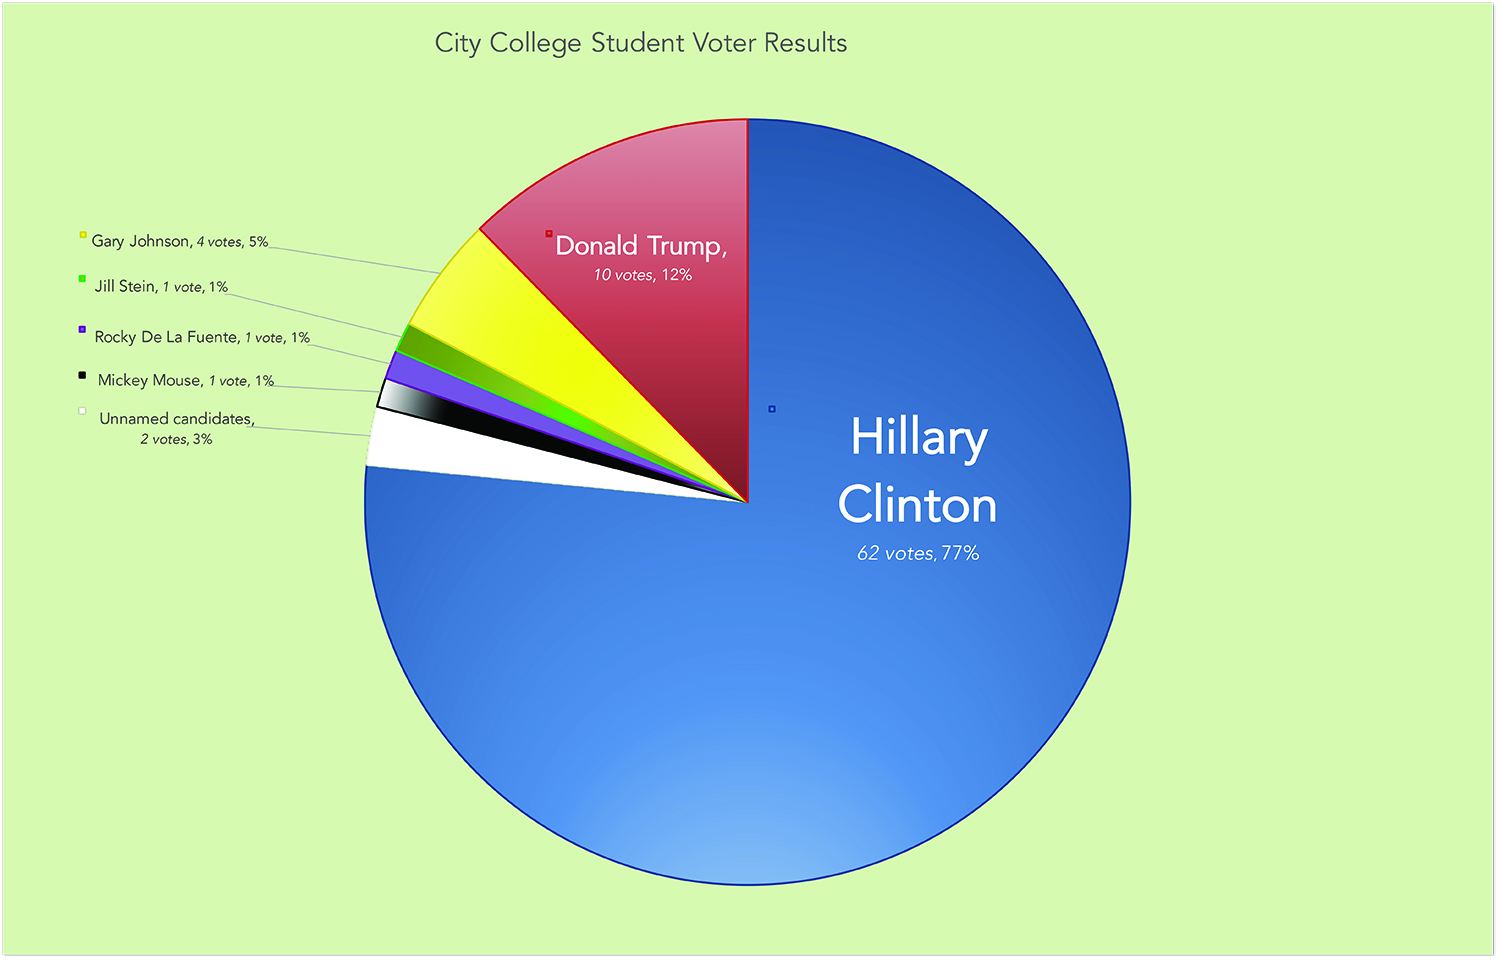
Seventy-seven percent (62) of student voters chose Clinton, while 8 percent (10) voted Donald Trump. Gary Johnson was the third most popular candidate, receiving 5 percent (4) of the student vote.
Nationwide, Clinton won 48 percent (64.7 million) of the popular vote versus Trump’s 46.5 percent (62.4 million).
Comparing the two, City College students were 29 percent more likely to vote for Clinton and 34 percent less likely to vote for Trump than the average U.S. citizen.
Forty-two percent (26) of students who voted for Clinton directly mentioned Trump as the main reason for their vote.
Seven others said they voted for Clinton because she was the lesser of two evils, while another seven voted for Clinton due to her being the “best,” “better” or “only” choice. Only one participant mentioned Bernie Sanders, and that person voted for Clinton.
Seventeen (27 percent) of those who voted for her gave a reason that supported her without referring to other candidates.
Seven of Clinton’s voters chose her because they supported her values, beliefs or policies, and five of referred to Clinton’s gender as the reason for their vote.
Other reasons included Clinton’s qualifications, experience, views on education and stance in regards to oil.
Meanwhile, three of the 10 voters who elected Trump cited Clinton as the reason for their vote; three others agreed with Trump’s values, beliefs or policies.
Other reasons for voting Trump differed depending on the individual, and included “making America great again,” “giving the country what it needs,” his “being an outsider,” and because the person’s family voted conservative.
 Of the 91 surveyed registered to vote, 69 percent (63) were Democrats and 13 percent (12) Republicans.
Nine were Independent, one was Green and two were Libertarian. Four did not identify with one of the 10 party options provided.
In comparison, a Gallup poll from October found that 27 percent of participants identified as Republicans, 32 percent as Democrats and 36 percent as Independents.
Seventy-one percent of those surveyed at City College were registered to vote, compared to 67 percent of eligible voters nationwide according to research institute Statistic Brain.
Taking into account all 129 participants, approximately 64 percent of those surveyed voted.
However, that figure increases to 69 percent when excluding those legally unable to vote; 55 percent of voting age American citizens voted for a presidential candidate.
Twenty-nine percent (38) of participants were not registered to vote. Among them, ten were legally prevented from voting due to factors like age and being international students.
Fourteen, however, said they did not register to vote because they were lazy, apathetic, procrastinated or forgot to register.
Four students said they didn’t have time to register, while another said she did not vote because the system was rigged.
Only two of the 38 students who did not register to vote did so because they believed it was pointless.